
Advertisement
New AMGA Survey Notes Significant Gains in Physician Compensation
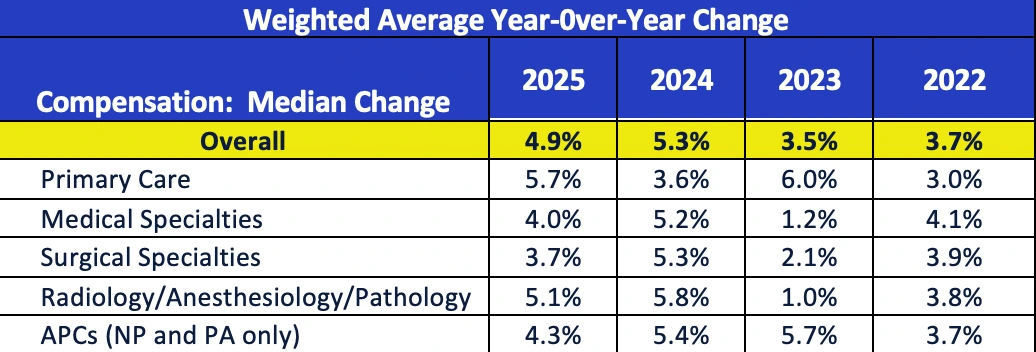
The newly published AMGA 2025 Medical Group Compensation and Productivity Survey reveals substantial increases in compensation for various clinical specialties in 2024. The results of this year’s survey show a 4.9% compensation increase across the entire dataset.
June 30, 2025
AMGA Consulting
Alexandria, VA – The newly published AMGA 2025 Medical Group Compensation and Productivity Survey reveals substantial increases in compensation for various clinical specialties in 2024. The results of this year’s survey show a 4.9% compensation increase across the entire dataset. This comprehensive analysis included data from ovFor the top surgical specialties, compensation and productivity increased 3.3% and 1.1%, respectively, with compensation per wRVU growth at 0.7%. er 184,000 providers across nearly 500 medical groups, encompassing almost 200 physicians, advanced practice clinicians (APCs), and other provider specialties. The survey is based on 2024 calendar year data.
Participating healthcare organizations reported significant compensation increases for most specialties. Primary care specialties led the way with a 5.7% increase, followed by increases for medical specialties at 4.0%, for surgical specialties at 3.7%, for radiology, anesthesiology, and pathology specialties at 5.1%, and for APCs at 4.3%.
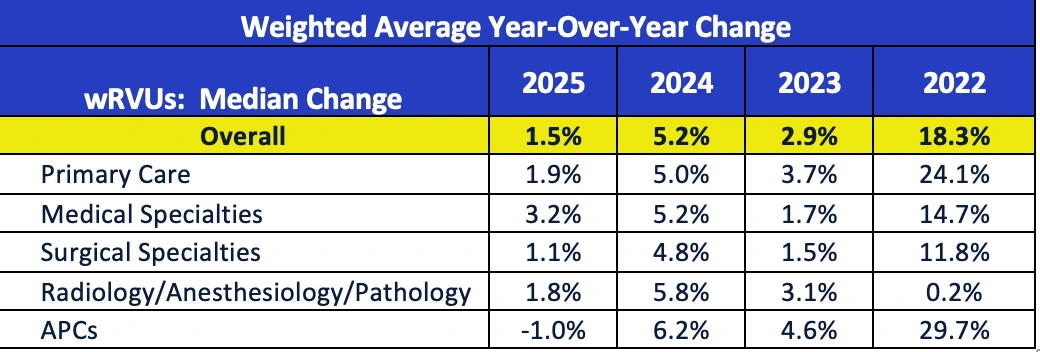
After years of fluctuation stemming from Centers for Medicare and Medicaid Services (CMS) Physician Fee Schedule changes in 2021 and the post-COVID recovery, productivity appears to be stabilizing across all specialties. Work relative value units (wRVUs) saw a relatively modest average increase of 1.5% overall in 2024. Increases in wRVUs often correlate to an increase in patient visits over the same period, which grew on average by 2.3%. In addition to visits, provider productivity can be influenced by many other factors affecting healthcare today, such as staffing levels and patient demand, effects of provider shortages on the current provider workforce, and increased utilization of APCs and team-based care models.
With compensation gains outpacing the growth in productivity, providers experienced a 3.2% increase overall in the compensation-per-work RVU ratio. This increase represents the largest growth in the ratio since the COVID-19 pandemic, which flattened in the period following the pandemic. Before COVID-19, the typical year-over-year increase in the overall weighted average compensation-per-wRVU ratio was consistently between +2% and +3%.
Top Specialty Results by Key Metric
Primary Care
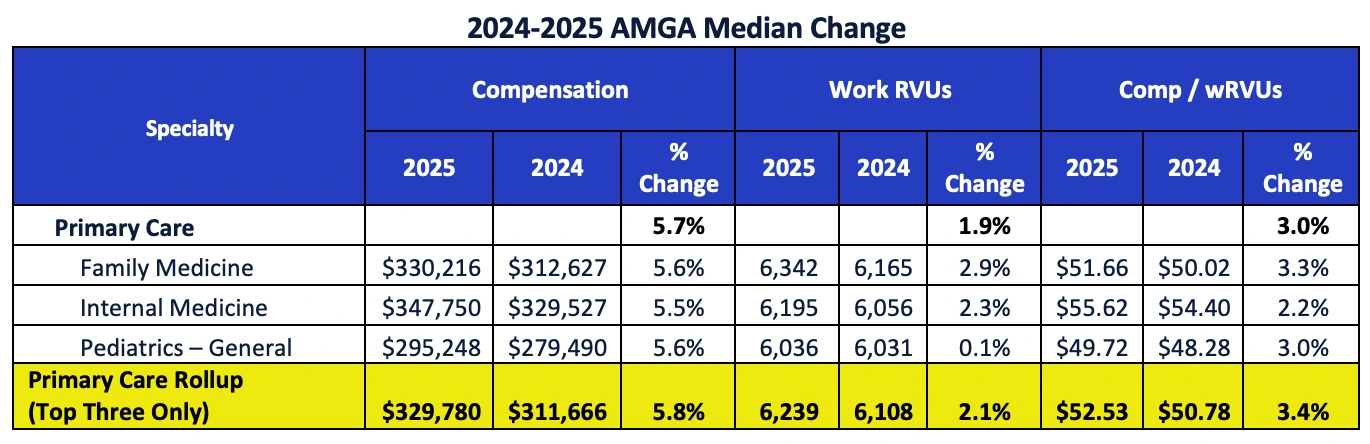
In a rollup of the top three specialties in primary care (family medicine, internal medicine, and pediatrics - general), median compensation changed from $311,666 in the 2024 Survey to $329,780 in the 2025 Survey, an increase of 5.8%. Productivity increased at a rate of 2.1% (6,108 wRVUs in 2024 to 6,239 wRVUs in 2025), resulting in a compensation-per-wRVU ratio increase of 3.4%.
Medical Specialties (Excluding Hospitalists)
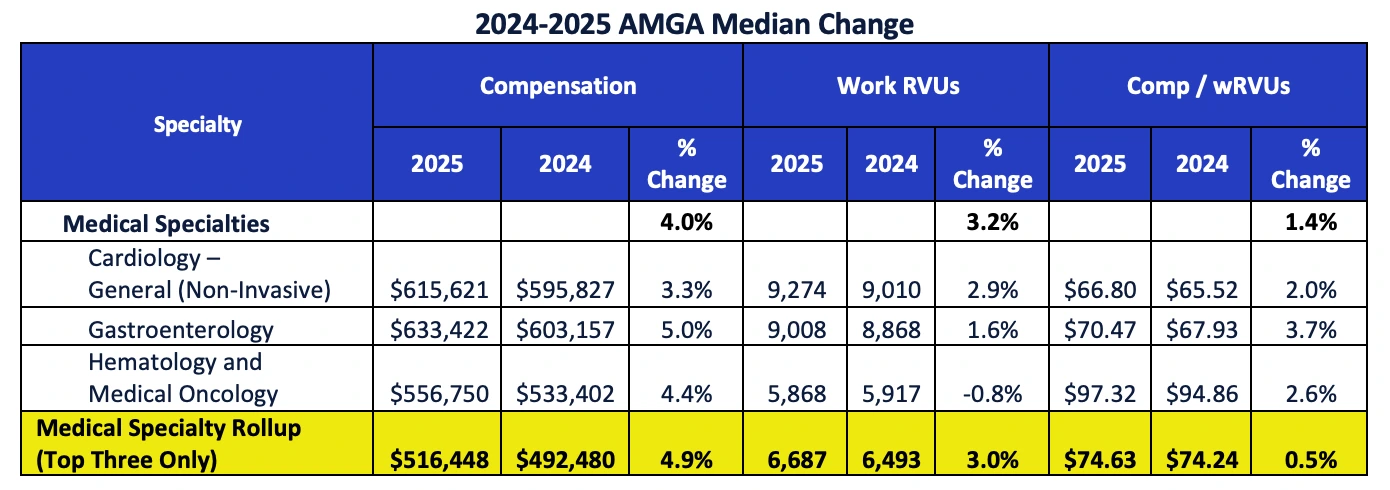
In a rollup of the top three medical specialties, which include more than 2,000 providers per specialty, the median compensation increase of 4.9% outpaced the 3.0% change in wRVUs.
Hospitalist Specialties
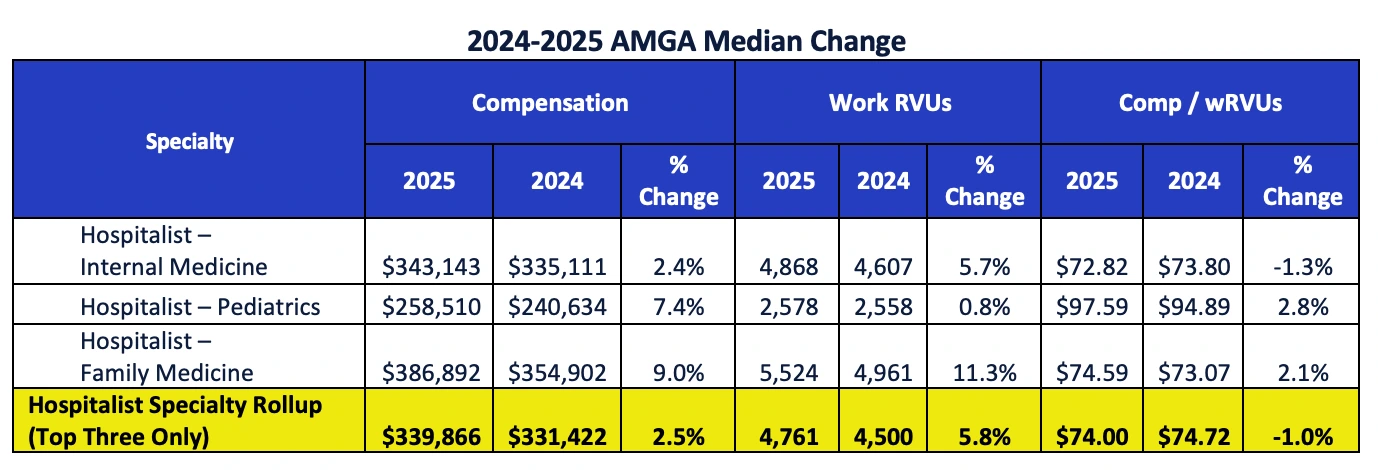
Unlike other medical specialties, hospitalist compensation grew a moderate 2.5%, while productivity saw a greater increase of 5.8%. With productivity growth outpacing compensation, the change led to a 1.0% decrease in the compensation-per-wRVU ratio, a notable contrast to other specialties.
Fred Horton, president of AMGA Consulting, offered the following insight: "While this decrease in the compensation-per-wRVU may seem insignificant, it may also be an indicator that groups are setting more specific work expectations for hospitalists, which indirectly is resulting in higher levels of wRVUs. Interest in annual patient-facing expectations for hospitalists and other shift-based specialties has grown over the past several years, with current survey annual expectations for hospitalists at 2,040 hours annually at median, with a median length of shift at 12 hours.”
Surgical Specialties
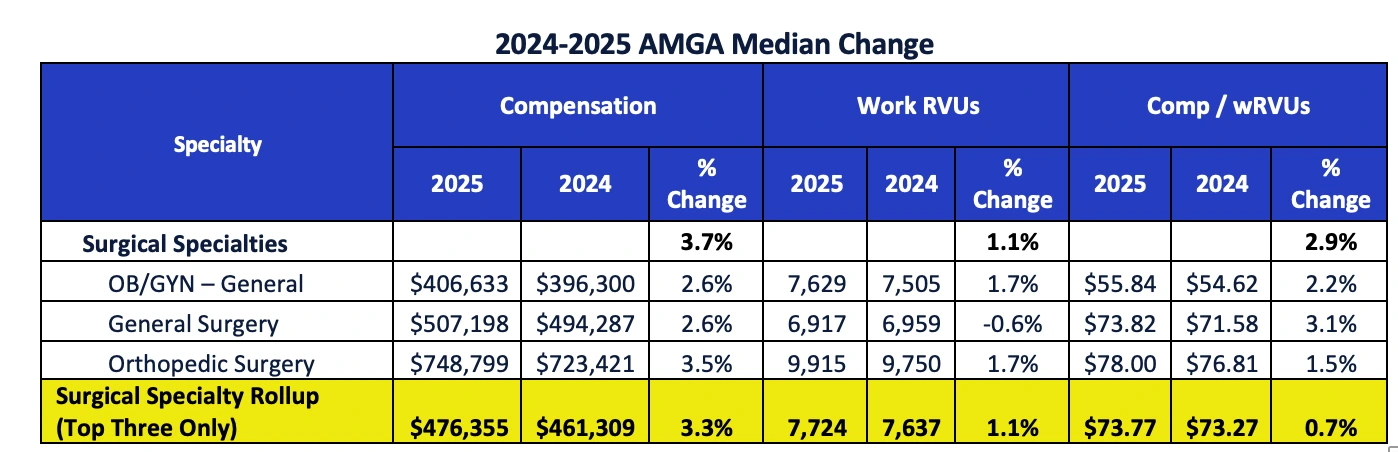
For the top surgical specialties, compensation and productivity increased 3.3% and 1.1%, respectively, with compensation per wRVU growth at 0.7%.
Advanced Practice Clinicians (APCs)
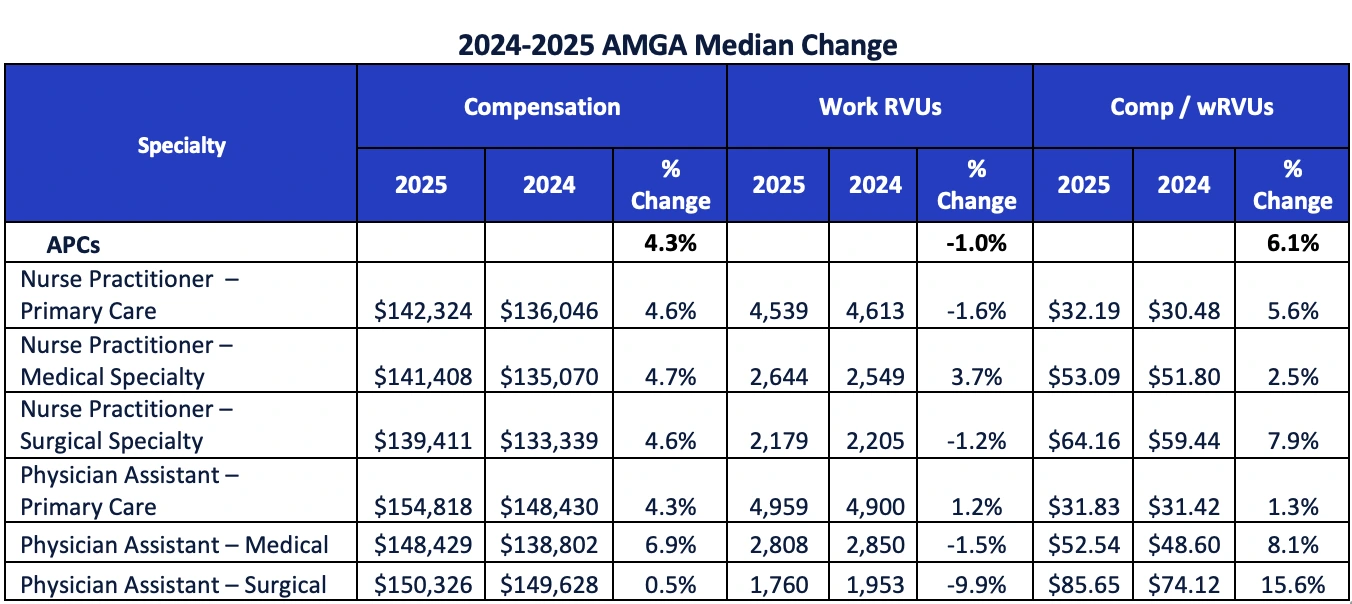
For APCs, compensation increased across all specialties, while there was only a marginal change in productivity (actually decreasing 1.0%). What is more interesting is the lackluster correlation between compensation and productivity for APCs.
“As the percentage of APCs to total provider workforce increases, health systems and medical groups are beginning to assess their approaches to compensation to ensure their plans’ philosophy, compensation plan mechanics and their care models are in alignment,” commented Mike Coppola, MBA, chief operating officer of AMGA Consulting.
Additional Survey Insights
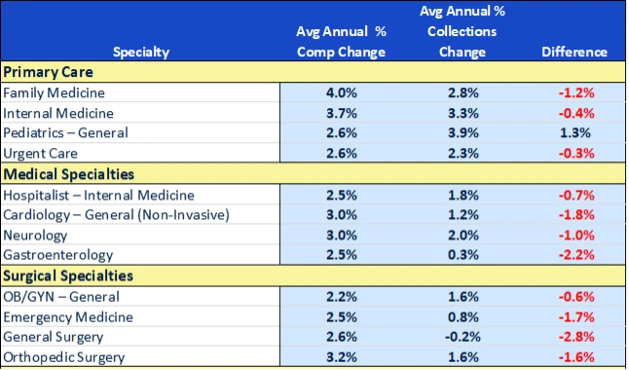
Net Collections
The AMGA 2025 Medical Group Compensation and Productivity Survey also includes professional net collections by individual provider, which increased 5.9% this year within primary care, medical, and surgical specialties. This past year (2024) was a tumultuous time for medical groups navigating a complex payment system. While initially decreasing the CMS conversion rate for Medicare reimbursement to 3.4%, Congressional intervention added back 2.9%, resulting in a less dramatic decrease. The initial decrease, however, forced medical groups and health systems to examine various tactics to mitigate the impact, including renegotiation of non-government contracts.
Physician enterprises today grapple with numerous factors affecting both provider productivity and compensation. The 2025 AMGA survey results clearly show compensation growth consistent with an industry facing a significant shortage of providers. Medical groups are attempting to balance their compensation strategies to align with organizational shifts toward value-based care, experimenting with team-based care and other alternative models, though adoption varies across the market.
At the same time, expectations around provider patient-facing hours, patient/panel volume, and annual clinical expectations are becoming more refined. Coppola commented, “Amid these evolving dynamics, one constant remains: We expect to continue to see strong demand for provider talent across many physician and APC specialties. In our opinion, this trend will continue to lead to analogous compensation increases for providers.”
“AMGA's survey data is invaluable as organizations navigate the diverse, and often competing, priorities within the provider enterprise,” noted Horton. “Without a solid understanding of these data, deeper insights, and emerging trends, it is virtually impossible to effectively manage competitive compensation levels, align provider compensation plans, standardize practices, design incentives, drive value, combat provider burnout, and meet industry-standard expectations. This year's survey offers a wealth of information to help you apply these data and insights to create alignment within your organization.”
About the Survey
The 38th edition of the AMGA Medical Group Compensation and Productivity Survey contains data across nearly 500 medical groups, representing over 184,500 providers from almost 200 physician, advanced practice clinician, and other provider specialties. To learn more and purchase the survey, visit AMGA Consulting’s website.
Press copies and data on a specific specialty or region are available. Please contact Taylor Martin if interested.
###
About AMGA Consulting
AMGA Consulting assists healthcare organizations in navigating the changing industry environment. AMGA Consulting builds clients’ organizational capabilities through effective governance, operational improvement, strategic alignment, talent management, provider compensation design, fair market value analysis, and total rewards solutions.
About AMGA
AMGA is a trade association leading the transformation of healthcare in America. Representing multispecialty medical groups and integrated systems of care, we advocate, educate, innovate, and empower our members to deliver the next level of high performance health. AMGA is the national voice promoting awareness of our members’ recognized excellence in the delivery of coordinated, high-quality, high-value care. More than 175,000 physicians practice in our member organizations, delivering care to one in three Americans.
AMGA represents medical groups and integrated systems of care. Its diverse membership includes multispecialty medical groups, integrated delivery systems, accountable care organizations, and other entities committed to improving healthcare outcomes. AMGA advocates for the formation of innovative, clinically integrated systems of care that advance population health, enhance patient experience, and reduce healthcare costs. For more information, please visit www.amga.org.